Remote detection and characterization of volcanic eruptions with infrasound : the Volcanic Information System
R. De Negri1, P. Hupe2, D. Gheri3, P. Labazuy1, A. Le Pichon4, E. Marchetti3, S.P. Näsholm5, P. Mialle6,
1 Université Clermont Auvergne, CNRS, IRD, OPGC, Laboratoire Magmas et Volcans, F-63000 Clermont-Ferrand, France
2 BGR, B4.3, Hannover, Germany
3 University of Florence, Earth Science Department, Italy
4 CEA, DAM, DIF, F-91297 Arpajon, France
5 NORSAR, Kjeller, Norway
6 CTBTO, Vienna, Austria
Contact: R. De Negri [rodrigo.denegri@uca.fr].
Background
Volcanic explosive eruptions produce large amounts of low-frequency (<20 Hz) acoustic waves, called infrasound (see Figure 1). Notably, infrasound waves experience minimal attenuation in the atmosphere and can propagate over hundreds to thousands of kilometers, being a valuable resource for remote monitoring of volcanic hazards.
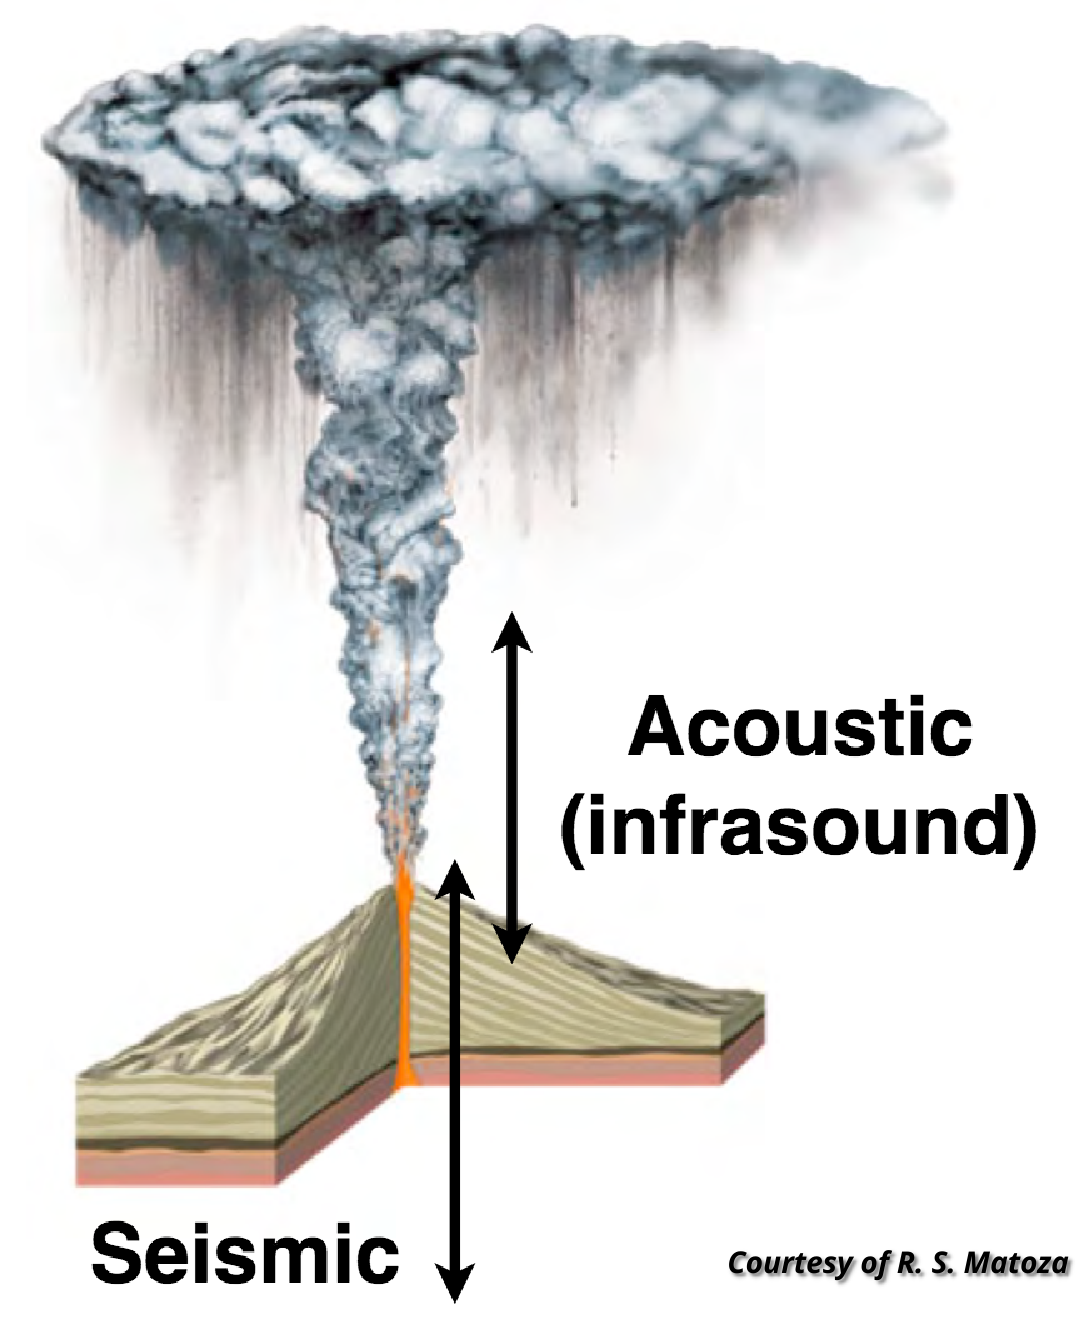
Figure 1: Schematic of a Plinian eruption, generating seismic waves through the solid Earth, and acoustic waves (infrasound) through the atmosphere.
In 2003, the Comprehensive Nuclear-Test-Ban Treaty Organization (CTBTO ; www.ctbto.org) established the International Monitoring System (IMS) infrasound network, which currently (2025) has 53 (of 60 planned) infrasound stations continuously recording to detect any nuclear explosion on Earth (see Figure 2).
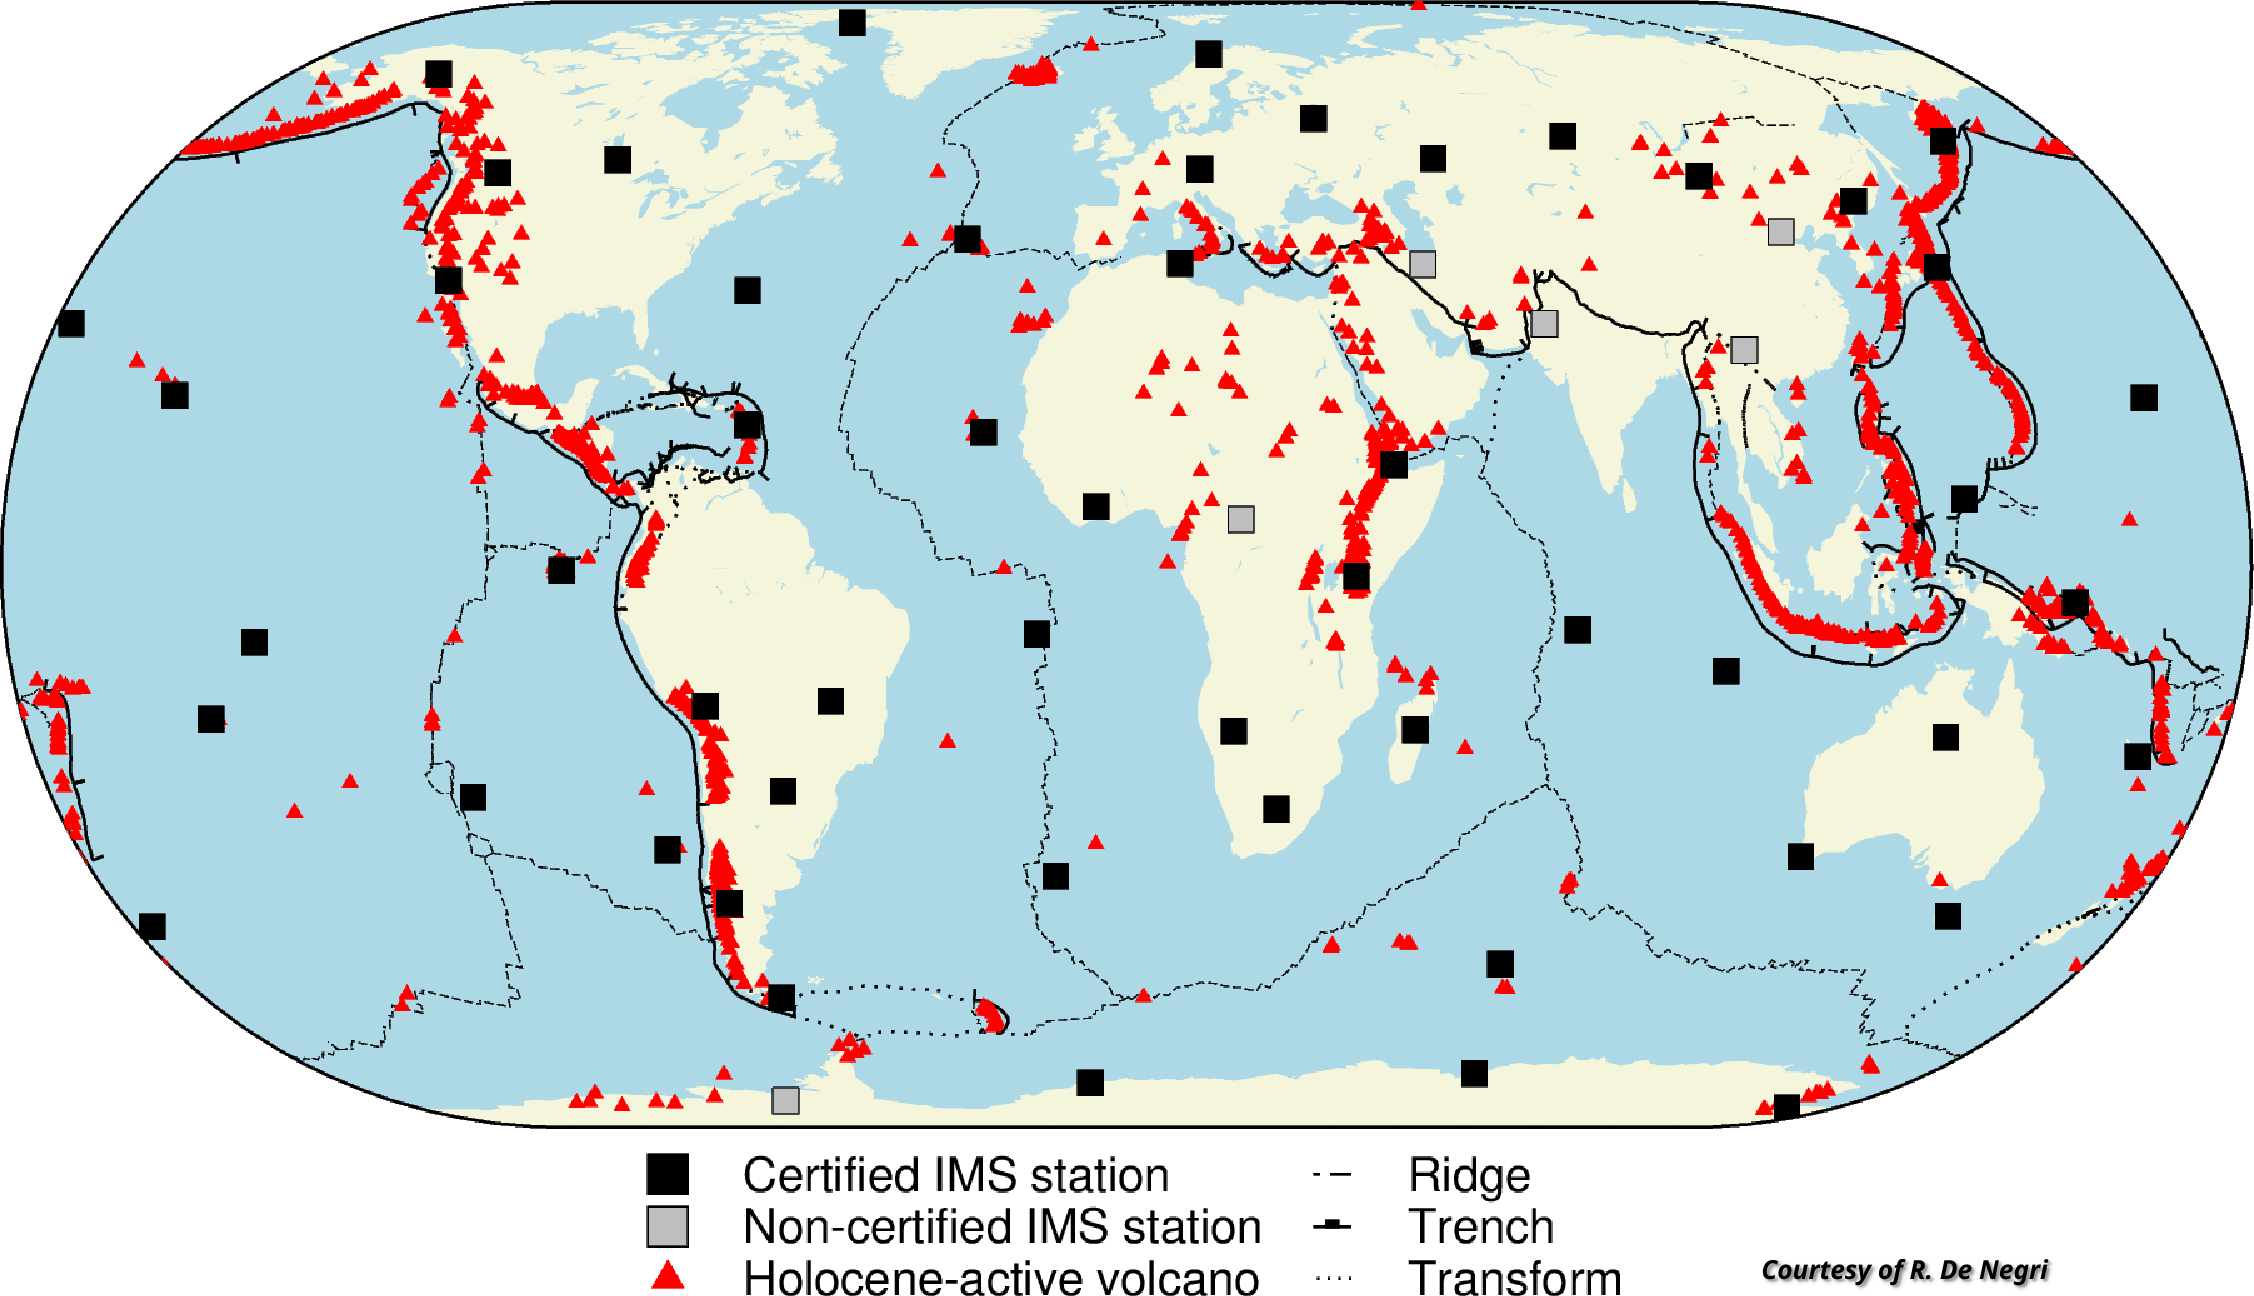
Figure 2: IMS infrasound network (black/grey squares), holocene-active volcanoes (red triangles), and plate tectonic boundaries (dashed/dotted lines).
The IMS infrasound stations have the potential to detect, locate, and characterize most of the explosive volcanic activity on the surface of the Earth (Figure 2). Matoza et al. (2017) applied this idea and introduced an infrasound methodology with an associated tool (IMS_vASC ; see https://github.com/rmatoza/ims_vasc) to achieve automated detection and cataloging of explosive volcanism. In their study, they used multiyear (2005-2010) detections from all the available IMS infrasound network stations to build a global acoustic catalog of volcanic eruptions. However, this study evidenced that the location of the source could be significantly deviated from its true location, which was primary linked to the assumption of a static, homogeneous atmospheric model (e.g., Matoza et al., 2017, 2018). This is an expected effect caused mainly by strong seasonal horizontal winds at stratospheric heights that modify the ray path of the signals, which a can change the apparent azimuth detected at the IMS stations up to ~12° in the most extreme cases (e.g., Le Pichon et al., 2005; Evers and Haak, 2005; De Negri et al., 2022).
Fortunately, this effect can be significantly reduced by modeling the seasonal back-azimuth deviation with available empirical climatologies like the Horizontal Wind Model (Drob et al., 2015) and the MSIS2 model (Emmert et al., 2020), coupled with 3D ray-tracing (see https://github.com/LANL-Seismoacoustics/infraGA; Blom et al., 2012). Such effects can be then corrected from the observed detections, increasing the long-range accuracy of the source location (see https://github.com/rodrum/arcade; De Negri et al., 2023; De Negri et al., 2025).
The Volcanic Information System
Another approach to long-range (>250 km) monitoring of volcanic eruptions was introduced by Marchetti et al., 2019. Here the volcano location is assumed (i.e., not a blind location method as in Matoza et al., 2017), and what matters is to have knowledge of the effective propagation speed of the sound at the ground and at stratospheric heights for the source-to-station propagation path, to then estimate the Infrasound Parameter (IP) to assess if an eruption is occurring. The IP is a non-physical value proportional to the amplitude and persistency of the detections from the volcano first used for local monitoring of Stromboli volcano, Italy (Ripepe et al., 2018).
This approach was successfully used to remotely detect and characterize the 2014–2016 eruptions of Etna volcano, Italy, from infrasound arrays at 560 to 1040 km from the volcano (Marchetti et al., 2019), and later tested using one IMS station (IS06, Cocos Island) to monitor the 2012–2019 eruptions of most volcanoes from Indonesia, at ~1000–2000 km from the station (Gheri et al., 2023). Recently, the same approach was used to characterize 2010–2019 reliability of 16 IMS locations on the globe to detect and characterize the nearest volcanoes (Gheri et al., 2025).
Based on the earlier results of the IP parameter adapted to long-range distance monitoring, a software prototype for long-range volcanic eruption notification called « Volcanic Information System » (VIS) was developed within the Atmospheric dynamics Research InfraStructure in Europe (ARISE) project (FP7, H2020), in collaboration with the Toulouse Volcanic Ash Advisory Centre (VAAC).
The VIS main goal is to detect volcanic eruptions at regional to global distances (15-250 km; >250 km) with sustained ash-columns and provide early warnings to mitigate the risk that eruptions pose to civil aviation. Additionally, it can reconstruct the chronology of eruptions, and could help provide volcanic source constraints (acoustic intensity, gas flow, etc.).
The VIS is designed to leverage the IMS global infrasound detections and any available local infrasound station to monitor volcanoes. The detections are calculated with the Progressive Multi-Channel Correlation (PMCC) method (Cansi, 1995 ; Cansi and Le Pichon, 2008), which separates coherent infrasound waves (detections) from incoherent signals (noise). As mentioned, the VIS uses the Infrasound Parameter (IP) criterion (Ripepe et al., 2018 ; Marchetti et al., 2019 ; Gheri et al., 2023 ; Gheri et al., 2025) to establish when an eruption is in course, accounting for atmospheric propagation effects, detection persistency, and amplitude (see Figure 3).
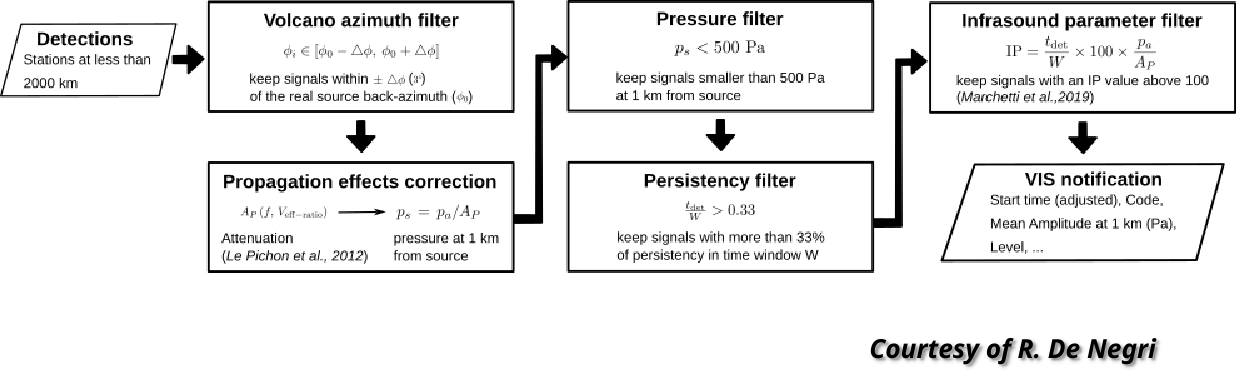
Figure 3: The VIS main steps to find a volcanic eruption.
Recently, we expanded the capabilities of the VIS to directly use streamlined and standardized
IMS-derived infrasound array signal processing data products (Hupe et al., 2023). These are open-access (OA), which potentially enable the VIS to be implemented as a global acoustic volcanic monitoring and eruptive analysis tool based on the IMS infrasound network.
We are currently performing regional multi-year test of volcanic notifications with the
VIS for the Toulouse VAAC area (see Figure 4), covering major historical eruptions (e.g., Etna, Piton de la Fournaise, Eyjafjallajoküll), and so trying to ensure the methodology behind the VIS Is as robust as possible. Along this line is, for example, the use of a time-dependent azimuth tolerance filter based on the seasonal modeled back-azimuth deviations (e.g., De Negri and Matoza, 2023 ; De Negri et al., 2025).
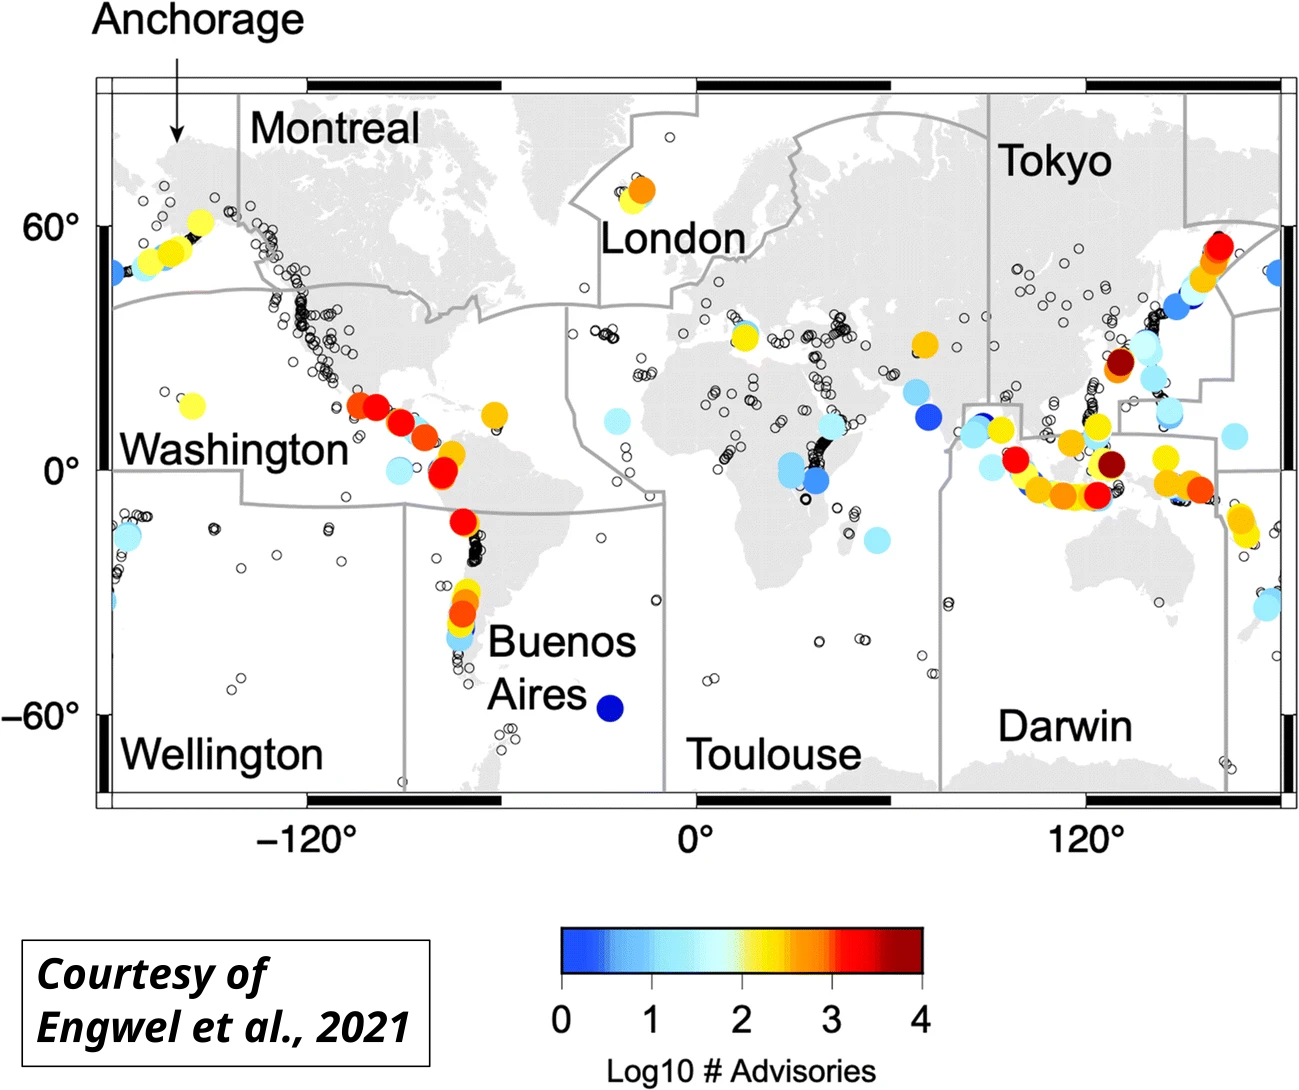
Figure 4: Volcanic Ash Advisory areas of the world and the number of advisories for each volcano. Original figure from Engwel et al., 2021.
With the IMS detections and OA products (2003-2022), added to the available HOTVOLC (https://hotvolc.opgc.fr; Gouhier et al., 2020) webGIS satellite notifications (2010-2022), we have built a preliminary catalog showing to what extent infrasound-only, and infrasound+satellite monitoring can achieve reliable eruption notifications in the area (e.g., Figure 5).

Figure 5: Area of interest (similar to Toulouse VAAC) containing stations (squares/romboid), and volcanoes (triangles) colored by nearest station (see colorbar on the left). Regions (triangles surrounded by a circle) are groups of volcanoes too close to each other to distinguish at global distances (>250 km).
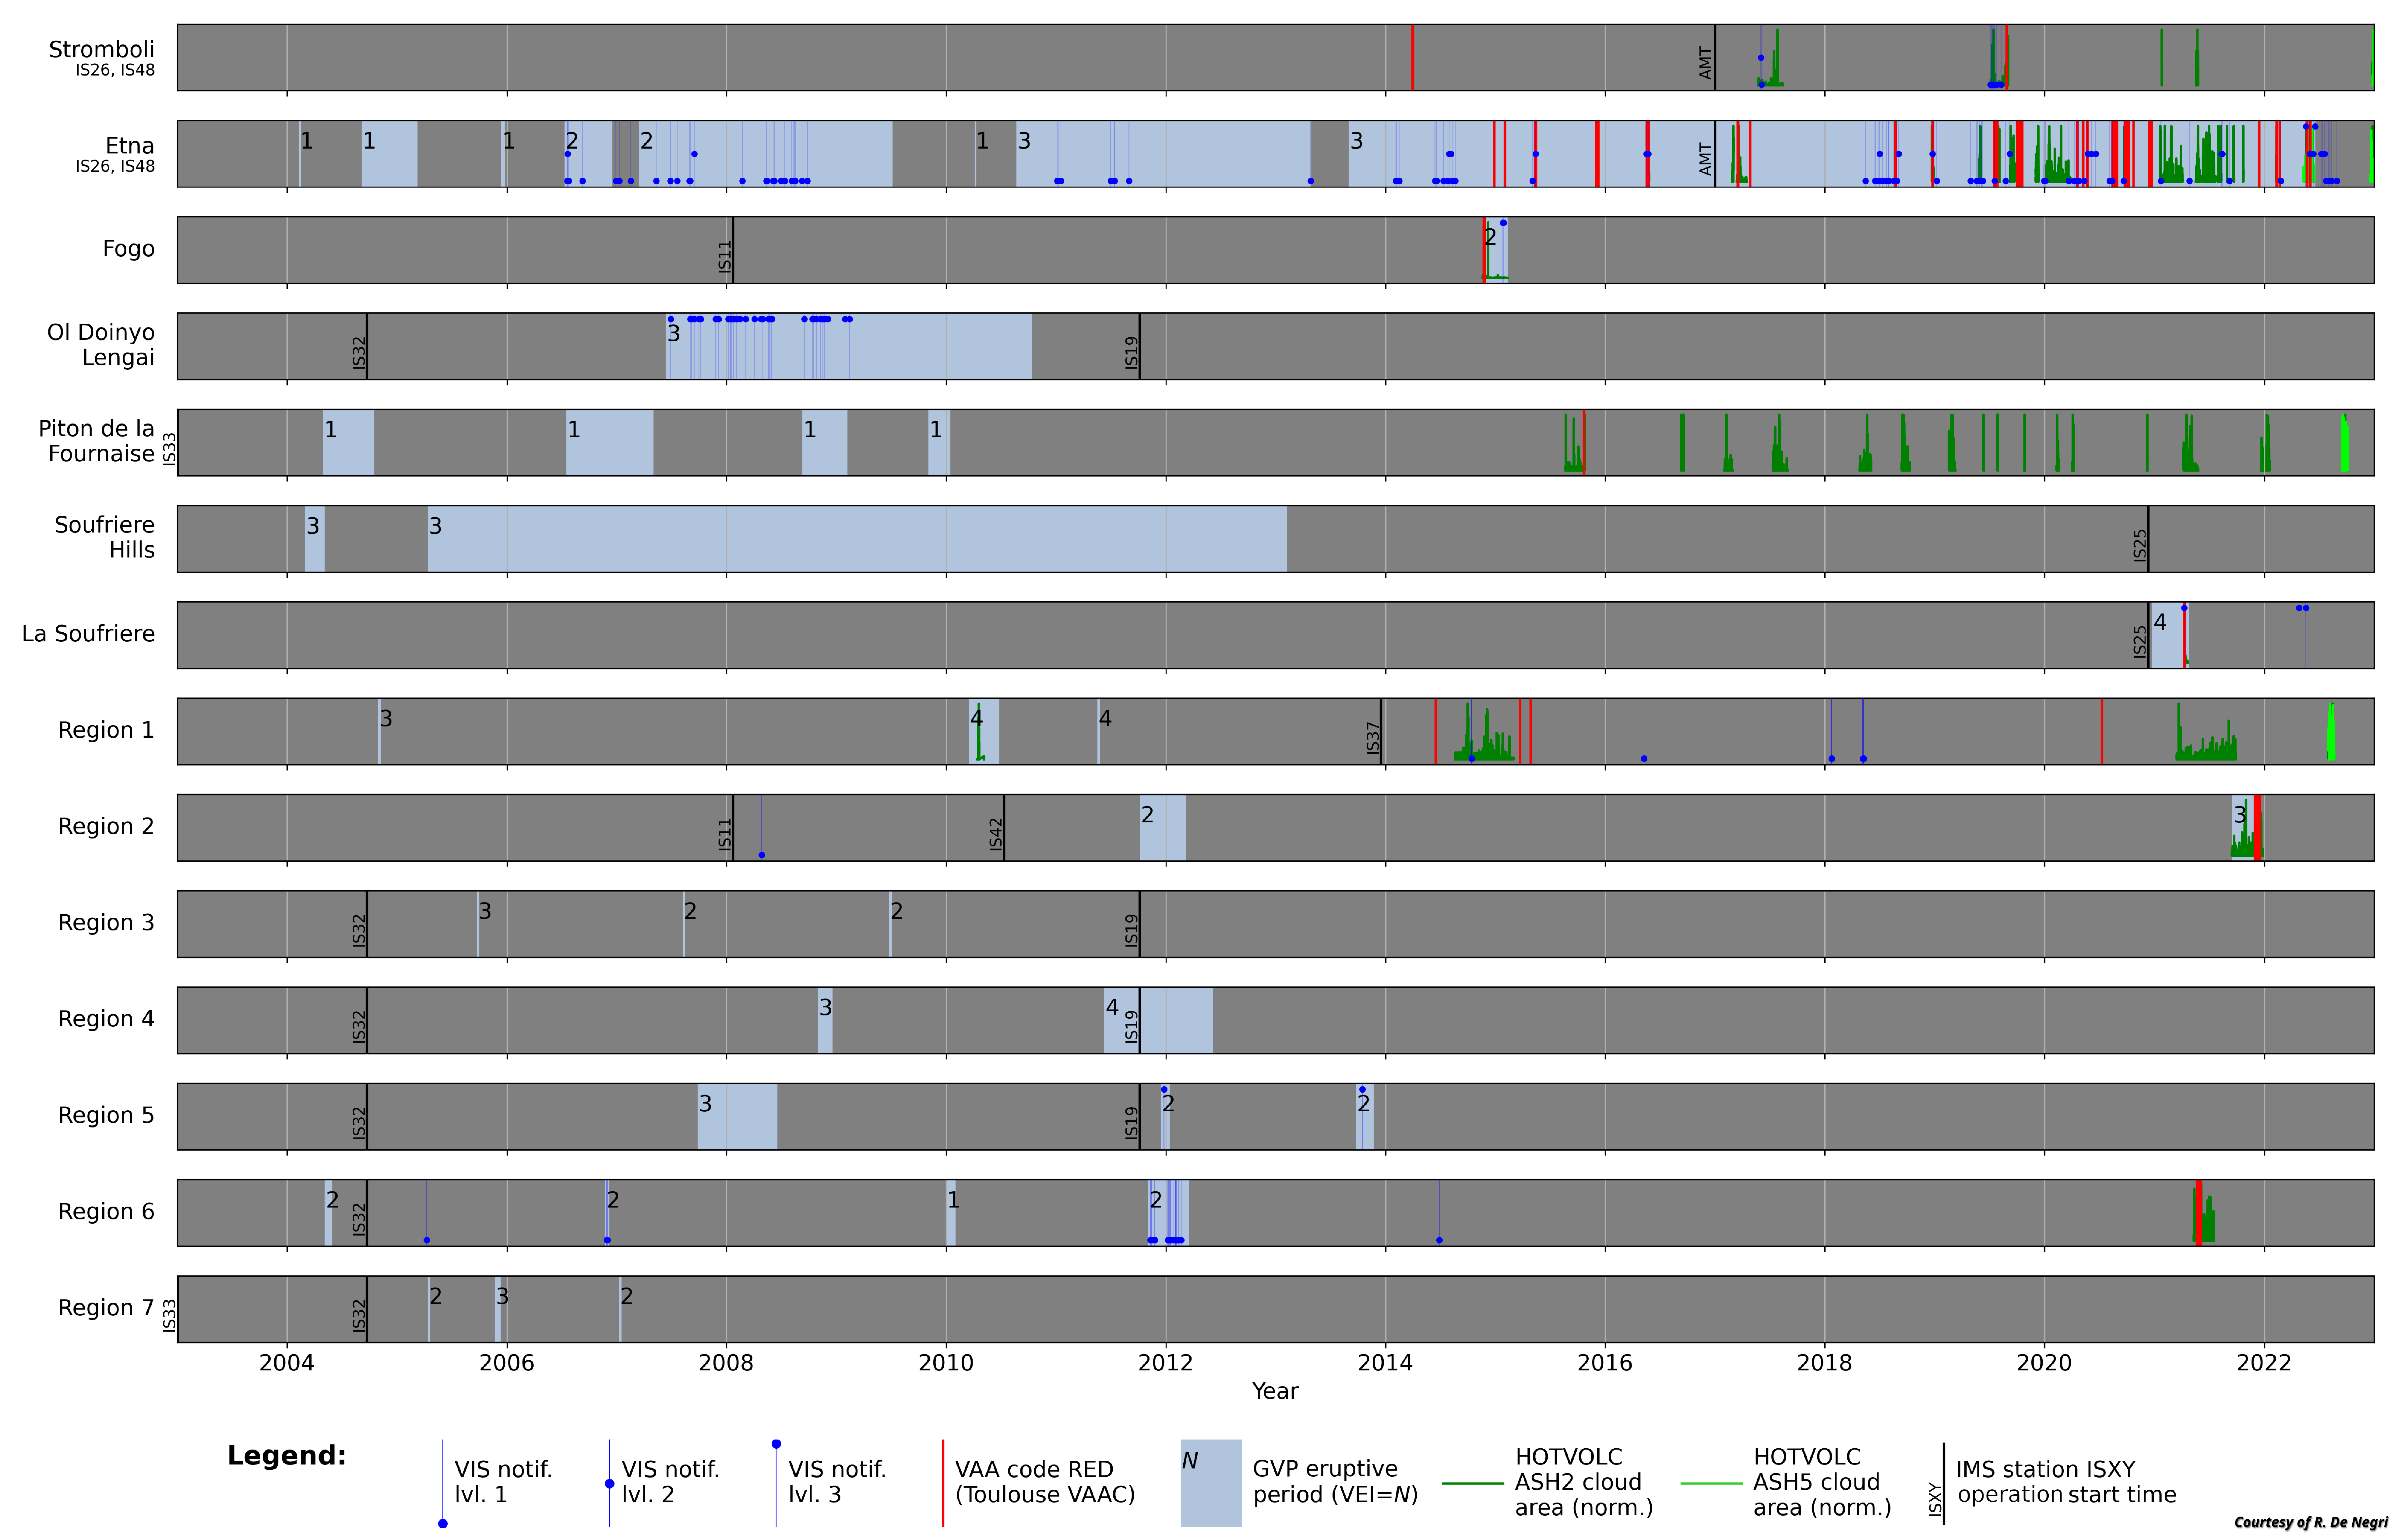
Figure 6 : Catalog of preliminary VIS notifications, HOTVOLC notifications, Tolouse VAAC red-coded notifications, and eruptive periods of the Global Volcanism Program (see legend on the bottom).
The data products of the VIS demonstrator will be available through an application programming interface (API) hosted at the Observatoire de Physique du Globe de Clermont-Ferrand (OPGC, CNRS-INSU and University Clermont Auvergne), where also an archived catalogue of European volcano eruptions and the real-time data products for AMT (Firenze, Italy) will be hosted.
As part of the European Geo-INQUIRE project (HORIZON-INFRA-2021-SERV-01), the VIS will be integrated into the Thematic Core Service Volcano Observation (TCS-VO) of the European Plate
Observing System (EPOS). Future developments will include integration into web services such as the HOTVOLC web-GIS interface (OPGC, CNRS-INSU) or the EPOS Data Portal.
References
Blom, P. and Waxler, R. (2012). Impulse propagation in the nocturnal boundary layer:
Analysis of the geometric component. The Journal of the Acoustical Society of
America. DOI : 10.1121/1.3699174, vol. 131, issue 5, pages 3680-3690.
Cansi, Yves (1995). An automatic seismic event processing for detection and location: the P.M.C.C. method. Geophysical Research Letters 22.9. DOI: 10.1029/95GL00468, pp. 1021–1024.
Cansi, Y. and Le Pichon, A. (2008). Infrasound Event Detection Using the Progressive Multi-Channel Correlation Algorithm. Signal Processing in Acoustics. DOI : 10.1007/978-0-387-30441-0_77, pp. 1425–1435.
De Negri, R., Rose, K. M., Matoza, R. S., Hupe, P., and Ceranna, L. (2022). Long‐Range Multi‐Year Infrasonic Detection of Eruptive Activity at Mount Michael Volcano, South Sandwich Islands. Geophysical Research Letters. DOI : 10.1029/2021GL096061, vol. 49, issue 7.
De Negri, R. and Matoza, R. S. (2023). Rapid Location of Remote Volcanic Infrasound Using 3D Ray Tracing and Empirical Climatologies: Application to the 2011 Cordón Caulle and 2015 Calbuco Eruptions, Chile. Journal of Geophysical Research : Solid Earth. DOI :10.1029/2022JB025735, vol. 128, issue 3.
De Negri, R. S., Matoza, R. S., Hupe, P., Le Pichon, A., Rose, K. M., Cevuard, S. and Niroa, J. J. (2025). Evaluating the temporal capability of empirical climatologies for rapid long-range volcanic infrasound propagation estimates using a multidecadal data set of persistent Vanuatu volcanic eruptions. Geophysical Journal International. DOI : 10.1093/gji/ggaf027, vol. 241, issue 1.
Drob, D. P., Emmert, J. T., Meriwether, J. W., Makela, J. J., Doornbos, E. Conde, M., Hernandez, G., Noto, J., Zawdie, K. A., McDonald, S. E., Huba, J. D. and Klenzig, J. H. (2015). An update to the Horizontal Wind Model (HWM): The quiet time thermosphere. Earth and Space Science. DOI : 10.1002/2014EA000089, vol. 2, issue 7, pages 301-319.
Emmert, J. T., Drob, D. P., Picone, J. M., Siskind, D. E., Jones Jr., M., Mlynczak, M. G., Bernath, P. F., Chu, X., Doornbos, E., Funke, B., Goncharenko, L. P., Hervig, M., E., Schwartz, M. J., Sheese, P. E., Vargas, F., Williams, B. P., and Yuan, T. (2020). NRLMSIS 2.0: A Whole-Atmosphere Empirical Model of Temperature and Neutral Species Densities. Earth and Space Science. DOI : 10.1029/2020EA001321, vol. 8, issue 3.
Evers, L. G. and Haak, H. W. (2005). The detectability of infrasound in The Netherlands from the Italian volcano Mt. Etna. Journal of Atmospheric and Solar-Terrestrial Physics. DOI : 10.1016/j.jastp.2004.09.002
Gheri, D., Marchetti, E., Belli, G., Le Pichon, A., Boulenger, V., Hupe, P., Ceranna, L., Mialle, P. and Héreil, P. (2023). Monitoring of Indonesian volcanoes with the IS06 infrasound array. Journal of Volcanology and Geothermal Research. DOI: 10.1016/j.jvolgeores.2023.107753, vol. 434.
Gheri, D., Marchetti, E., De Negri, R., Hupe, P., Belli, G., Le Pichon, A., Näsholm, S. V. and Mialle, P. (2025). Detecting explosive volcanism using global long-range infrasound data. Journal of Volcanology and Geothermal Research. DOI :10.1016/j.jvolgeores.2025.108320, vol. 462.
Gouhier, M., Deslandes, M., Guéhenneux, Y., Héreil, P., Cacault, P. and Josse, B. (2020). Operational Response to Volcanic Ash Risks Using HOTVOLC Satellite-Based System and MOCAGE-Accident Model at the Toulouse VAAC. Atmosphere. DOI :10.3390/atmos11080864, vol. 11, issue 8.
Hupe, P., Ceranna, L., Le Pichon, A., Matoza, R. S. and Mialle, P. (2021). International Monitoring System infrasound data products for atmospheric studies and civilian applications. Earth System Science Data. DOI : 10.5194/essd-2021-441, vol. 2022, issue 14, pages 4201-4230.
Le Pichon, A., Blan, E., Drob, D., Lambotte, S., Dessa, J. X., Lardy, M., Bani, P., and Vergniolle, S. (2005). Infrasound monitoring of volcanoes to probe high-altitude winds. Journal of Geophysical Research Atmospheres. DOI :10.1029/2004JD005587, vol. 110, issue 13, pages 1-12.
Le Pichon, A., Ceranna and L., Vergoz, J. (2012). Incorporating numerical modeling into estimates of the detection capability of the IMS infrasound network. Journal of Geophysical Research : Atmospheres. DOI :10.1029/2011JD016670, vol. 117, issue D5.
Marchetti, E., Ripepe, M., Campus, P., Le Pichon, A., Vergoz, J., Lacanna, G., Mialle, P., Héreil, P. and Husson, P. (2019). Long range infrasound monitoring of Etna volcano. Scientific Reports. DOI : 10.1038/s41598-019-54468-5, vol. 9, issue 1.
Ripepe, M., Marchetti, E., Delle Donne, D., Genco, R., Innocenti, L., Lacanna, G. and Valade, S. (2018). Infrasonic Early Warning System for Explosive Eruptions. Jornal of Geophysical Research : Solid Earth. DOI : 10.1029/2018JB015561, vol. 123, issue 11.
Rodrigo DE NEGRI – LMV